Graph Widget in Dashboards

Overview
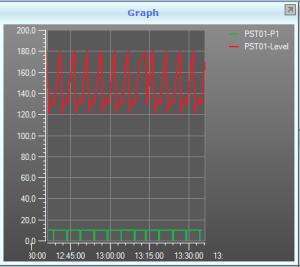
In the Dashboard widget you can present object values in a graphically manner for one or several IGSS objects. The graph timeline will, for each object, show if any data is available for a given time period.
Preconditions
Data must exist for the selected objects, within the defined Dashboard Time Interval. If no data exist, the graph will just appear as empty.
Adding the graph widget to your dashboard
- Open the relevant dashboard. Make sure you are in Configuration mode.
- On the Configuration tab, under the Insert Widget group, click the Graph icon.
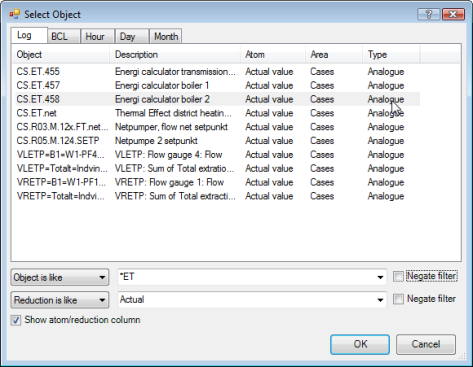
- On the Graph tab, under the Objects group, click the Add button. This will open a new dialog box.
- Select the object data that you want to add to the graph, for example the Actual value for the analogue object CS.ET.458 (see figure).
- Click OK.
If you want to present more object in the graph, repeat step 3-5 for these objects.
Navigating the graph window
In the graph window, you can move the view to another time:
- By dragging with the mouse in the graph window
- By clicking in the graph timeline
- By using the scroll bar which appear below the graph timeline
To see the graph timeline and scroll bar, simply move the cursor to the bottom of the graph widget window. The timeline and scroll bar will then automatically pop up.
You can also dynamically change the Y-Axis by dragging vertically with the mouse on a selected Y-axis.
Deleting the widget
- Select the widget. The title bar changes color to indicate active state.
- Select the Configuration tab, under the Widget group, click the Delete button.
Functions available in the Ribbon
To explore all the functions of the Ribbon please refer to the

